

Anatomy
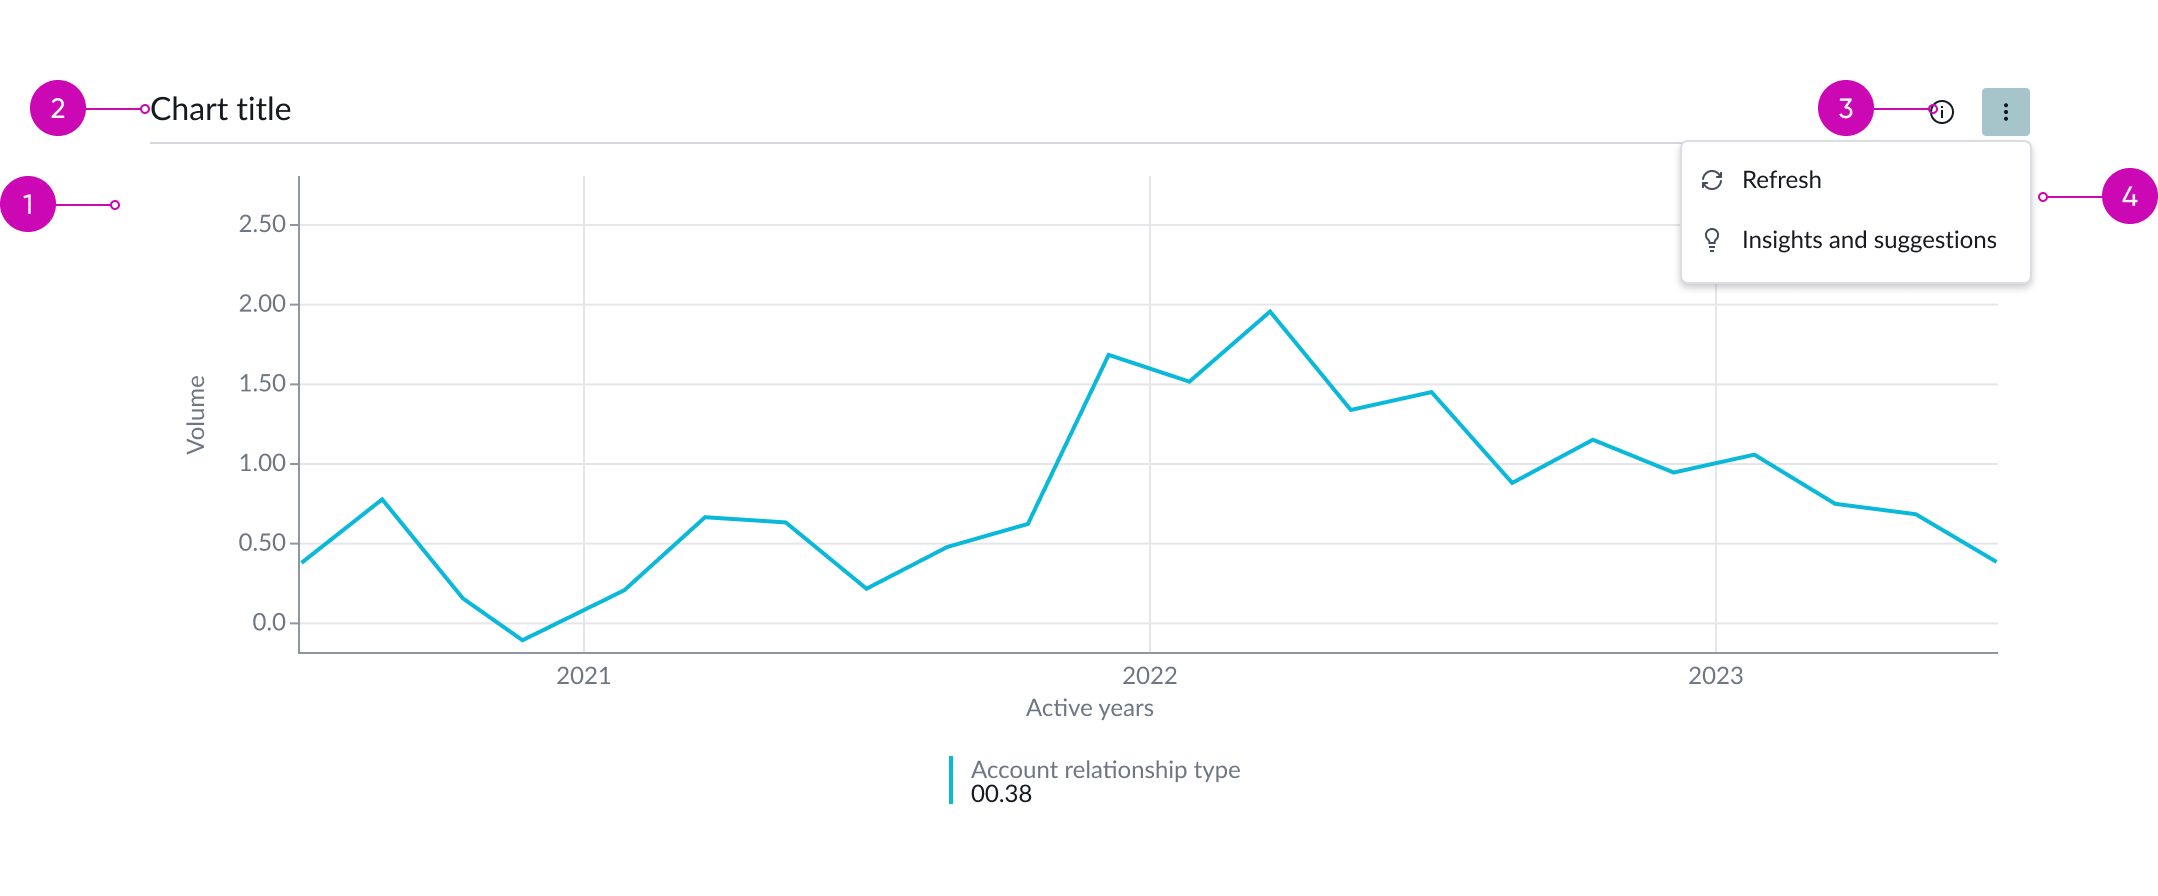
- Container: Displays the selected chart type
- Chart title/header: Displays the chart header
- Information icon: Displays the description of the chart
- Contextual menu dropdown: Contains extended interactions for the chart
Usage
The data visualization component is a container for available chart types. You select the chart type to display data in different ways depending on your application. You can use the data visualization container in standard landing pages and dashboards in UI Builder or in pages built with the Next Experience UI Framework.
Visualization types
You can select from the following charts to display your data: time series, bar, pie and donut, single score, heatmap, bubble, and gauge. The UI Builder displays the data from the data source in a chart of the type you select. The configuration options vary with the chart type you select. These chart types are available.
See usage guidance for single score
See usage guidance for time series
See usage guidance for bar chart
See usage guidance for pie and donut
See usage guidance for dial chart
See usage guidance for pivot table
See usage guidance for heatmap
See usage guidance for user experience analytics - funnels