Anatomy
Learn about the individual parts of process optimization map.
Process graph
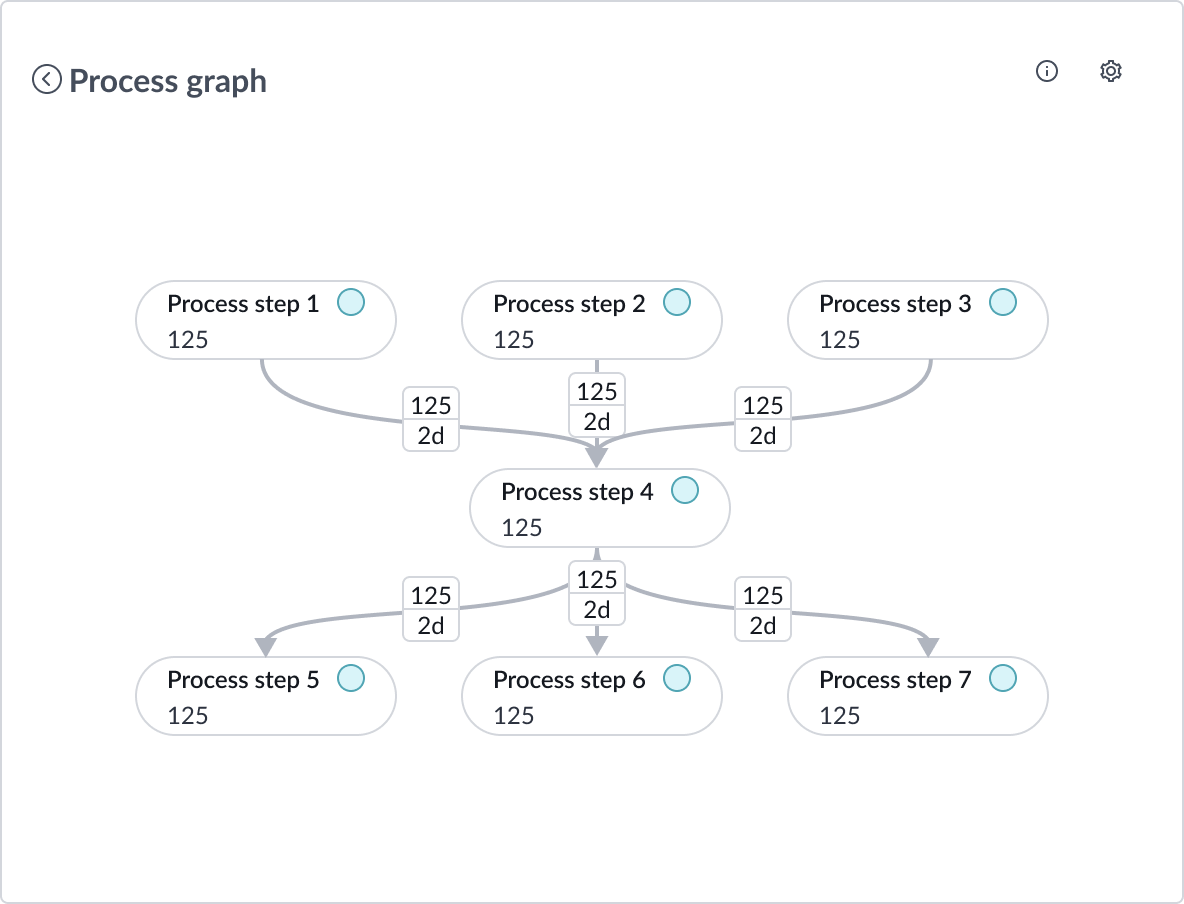
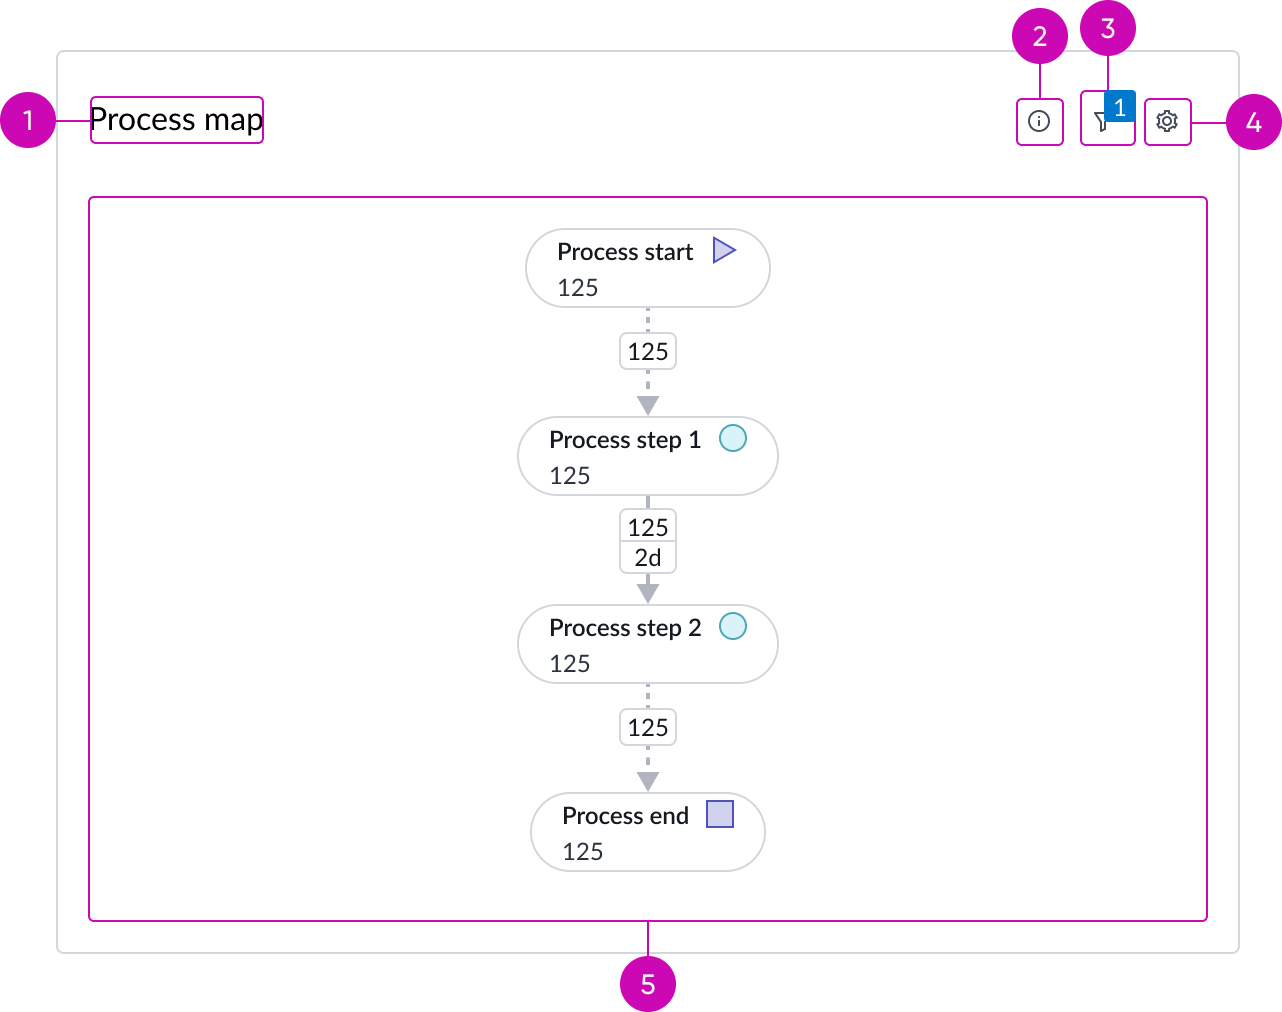
By default, the process optimization map component appears as a process graph type of diagram.
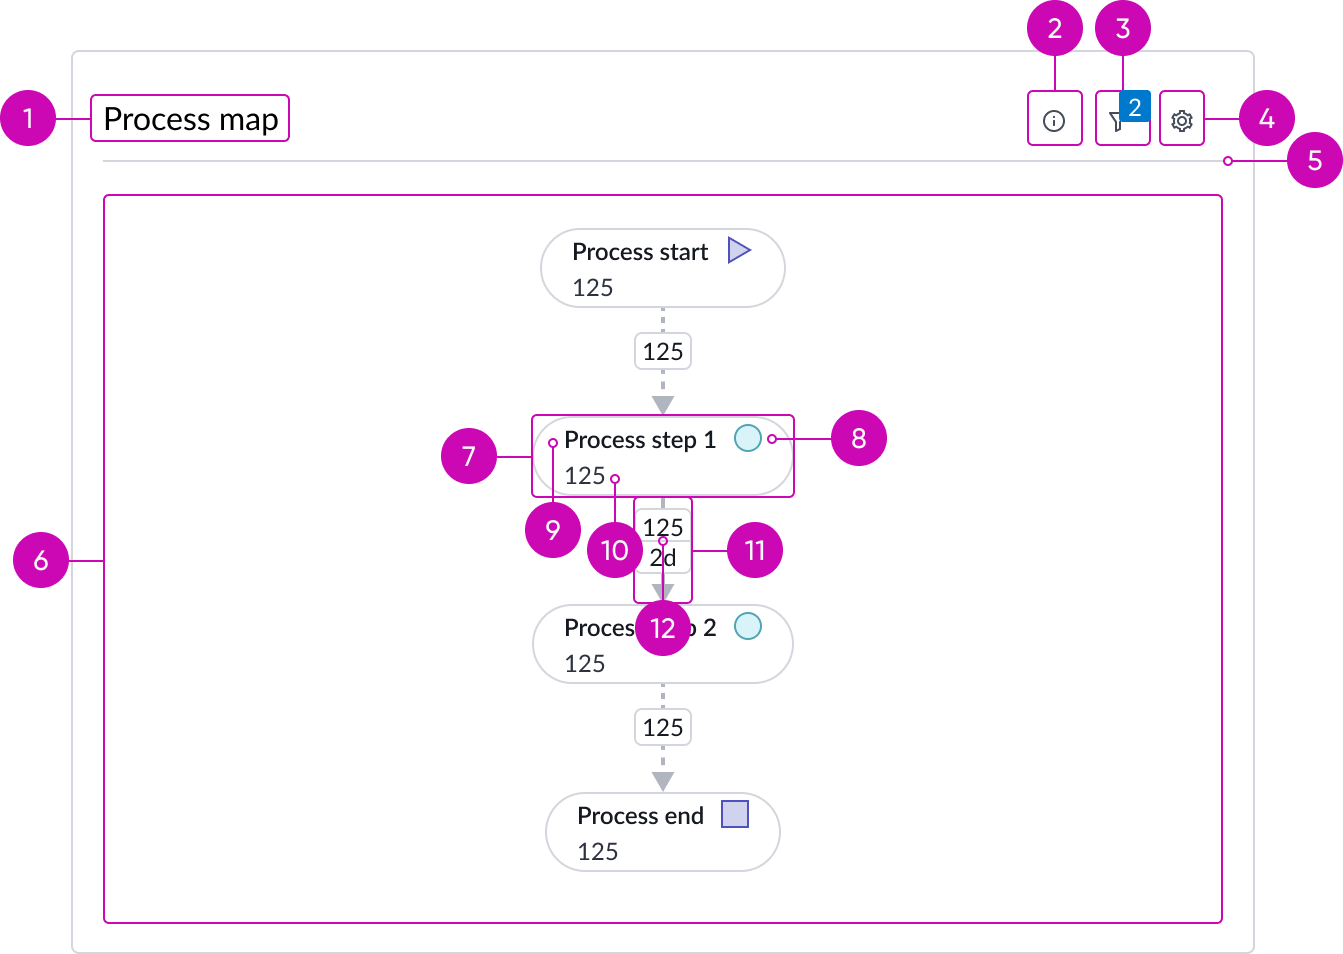
- Header (optional): Provides a title area and additional actions for interacting with the component
- Info: Opens a popup with information about the process map and the optimization date
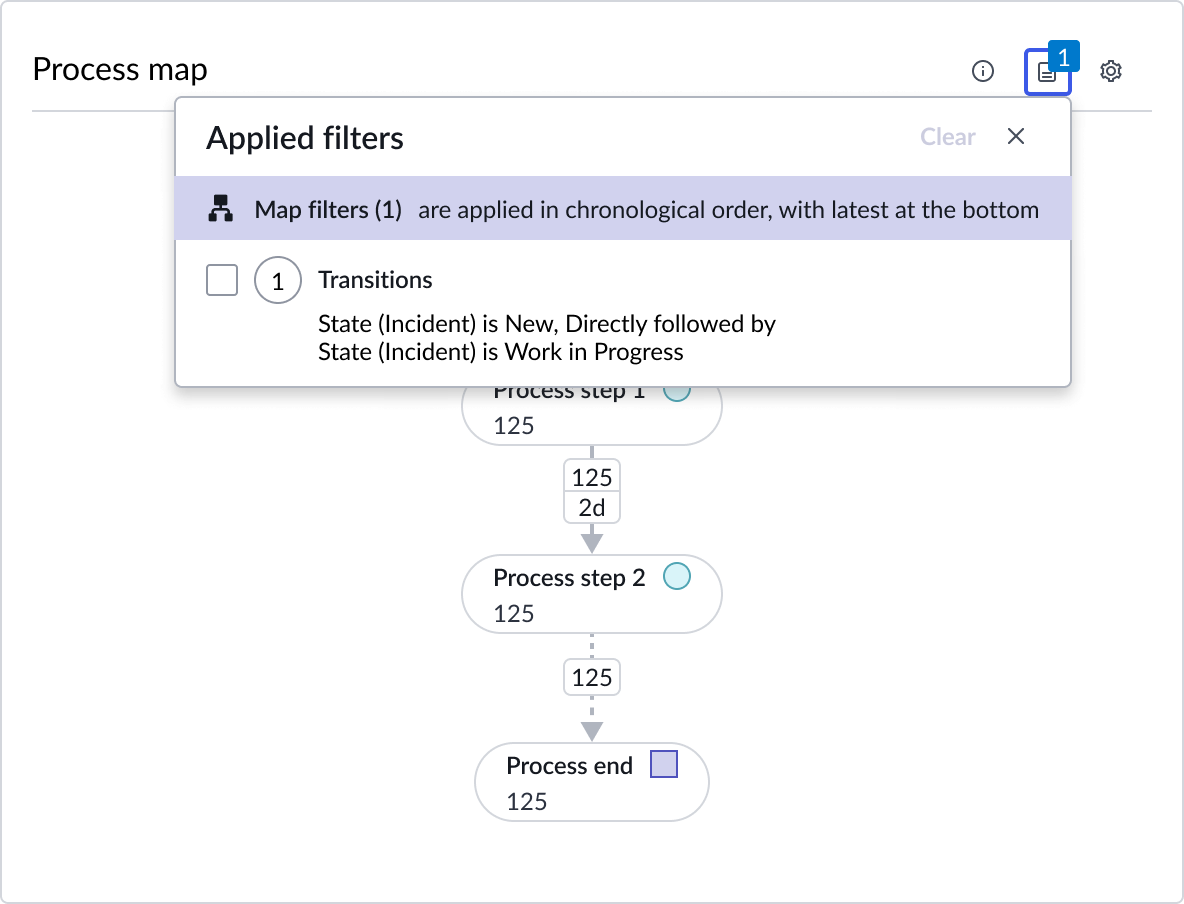
- Filter and badge (Optional): Opens a popup containing filter information when filters are applied; badge shows how many filters are active
- Settings: Provides the ability to adjust the visualization in the map area; for process map view, settings provides adjustments to activity nodes and connections, zoom in and out or fit to space, and the ability to toggle on and off "case follow simulation.”
- Header divider (optional): Visually separates the header and the map area
- Map area: Provides the space to view and interact with the process map
- Activity node: Represents a step in a process; thicker and darker borders indicate a larger number of records.
- Activity node type: A visual indication of the type of activity in the process; such as state, assignment group, and priority. The purple triangular arrow always represents process start; purple square always represents process end.
- Activity node title: Title of the node and activity name.
- Activity node metric: Provides information about the number of records for this node.
- Connection: Represents the transition between two activities—how many records went from activity node 1 to activity node 2, and how long it took on average; thicker and darker borders indicate a larger volume or duration. A dashed line connects the start activity node to the next node in the process and the end activity node to the previous node in the process; the start and end connections only display the number of records that started or ended on that activity node.
- Connection metrics: Provides information about metrics related to a transition, such as number of records and duration time; connections between the process start activity node and the next activity, and between the process end and the previous activity, only show the number of records.
Star graph
The star graph type of diagram displays the inputs and outputs for a selected node to more easily visualize the relationships coming in and going out of it.
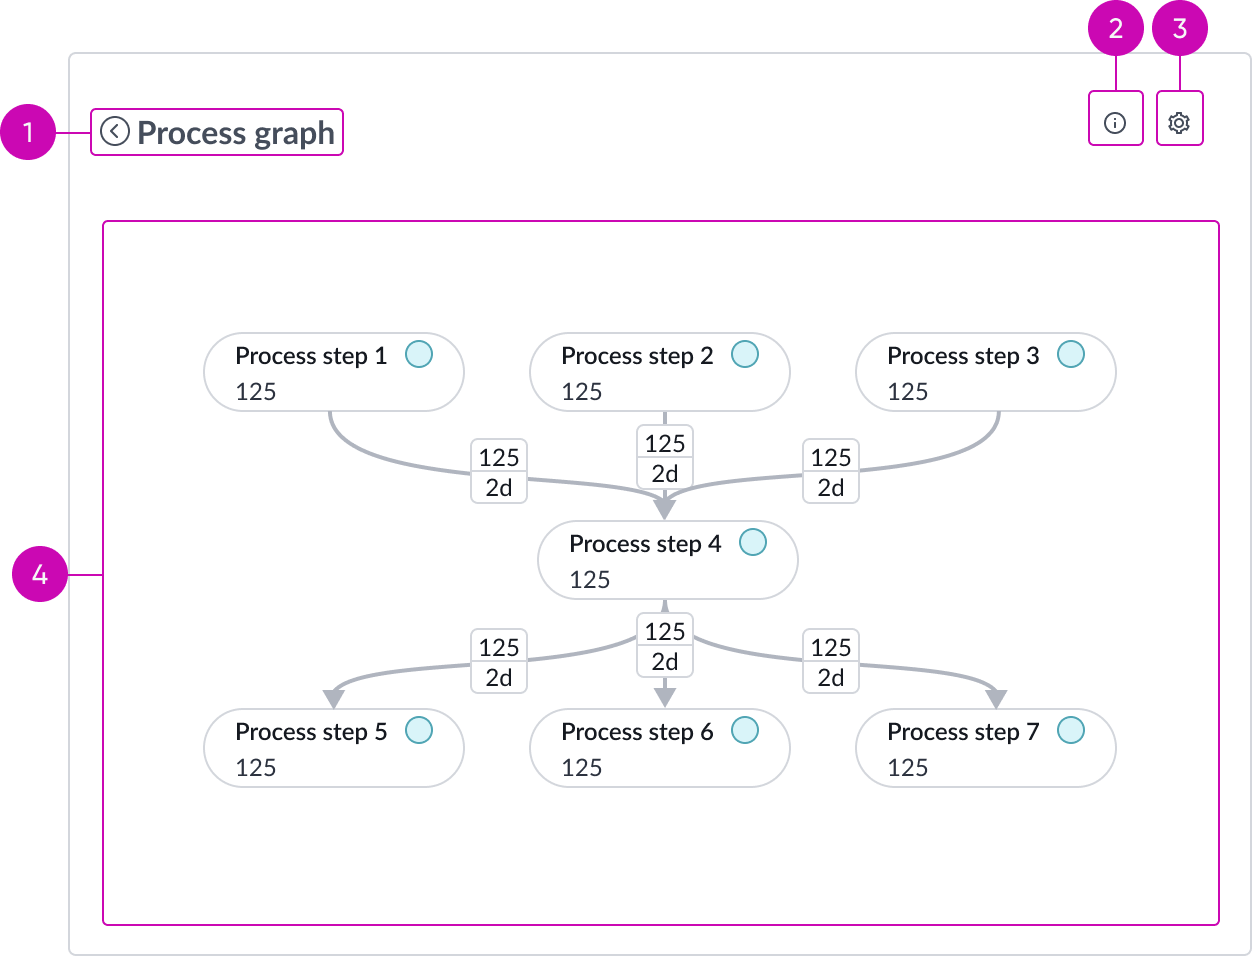
- Process graph link: Provides a link back to the process graph for the user
- Info: Opens a popup with information about the star graph and the optimization date
- Settings: Provides the ability to adjust the visualization in the map area; for star graph view, settings provides the ability to adjust the percentage of connections displayed, which affects what activity nodes are available, display All, Incoming, or Outgoing connections and their activity nodes, and zoom in and out of the graph, or zoom to fit the full screen.
- Map area: Provides the space to view and interact with the process optimization map (Star graph)
Usage
A process optimization map is a visual tool that outlines the sequence of steps and decisions involved in a particular process. It helps to clarify roles, responsibilities, and the flow of information, making it easier to identify bottlenecks, redundancies, and areas for improvement. By providing a clear, visual representation, process optimization map enhances communication, streamlines workflows, and supports continuous improvement efforts.
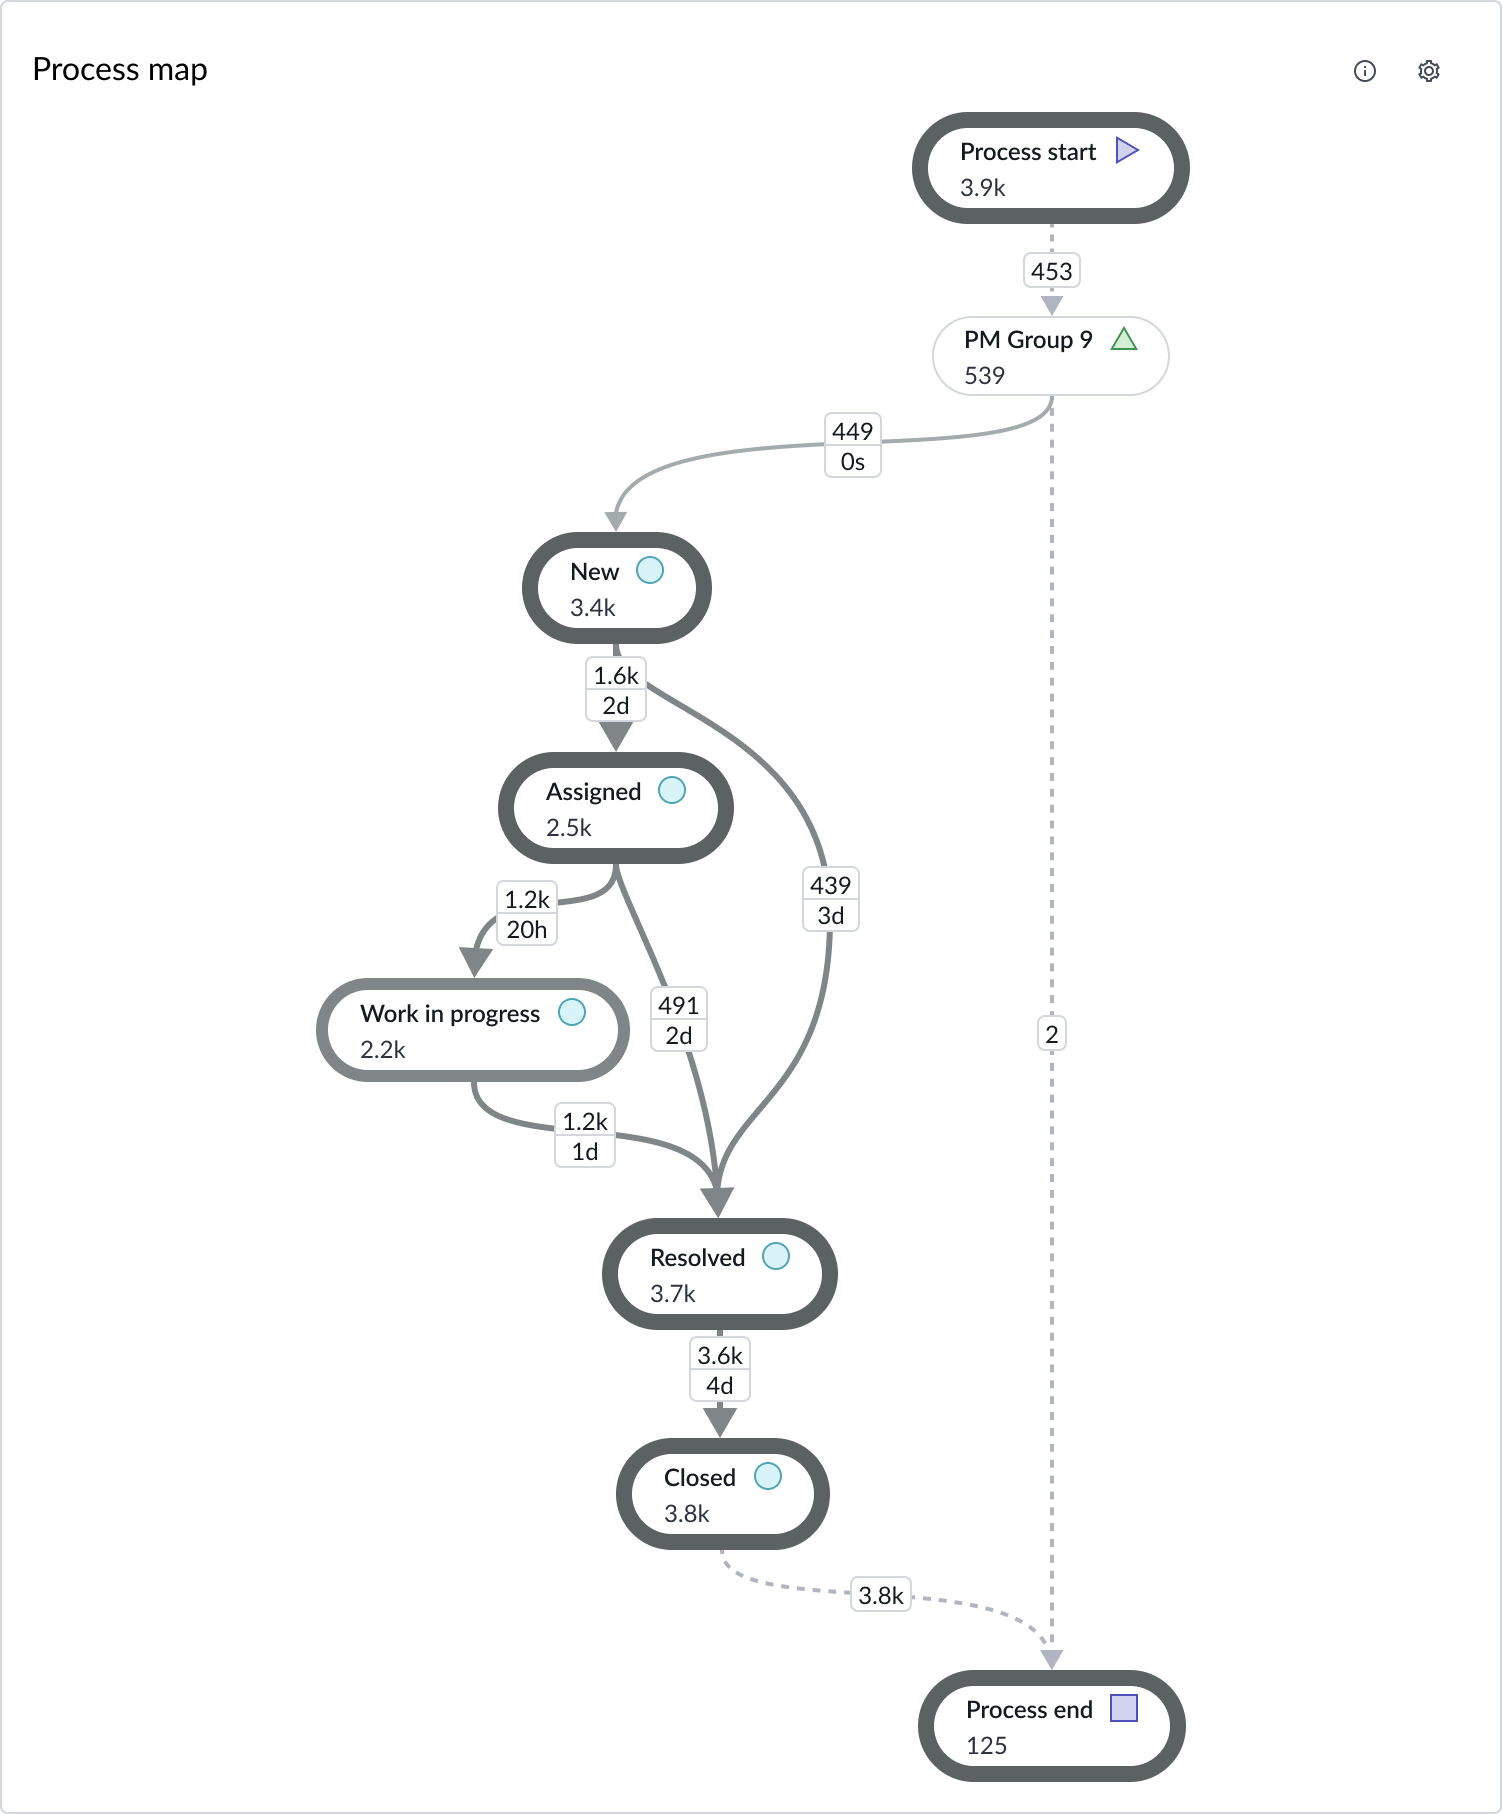
Process graph
The process graph type of diagram shows all the process steps in a process optimization map from start to finish. Activity nodes and connections use border thickness and color to visually differentiate the higher values from lower ones within the process optimization map.
Star graph
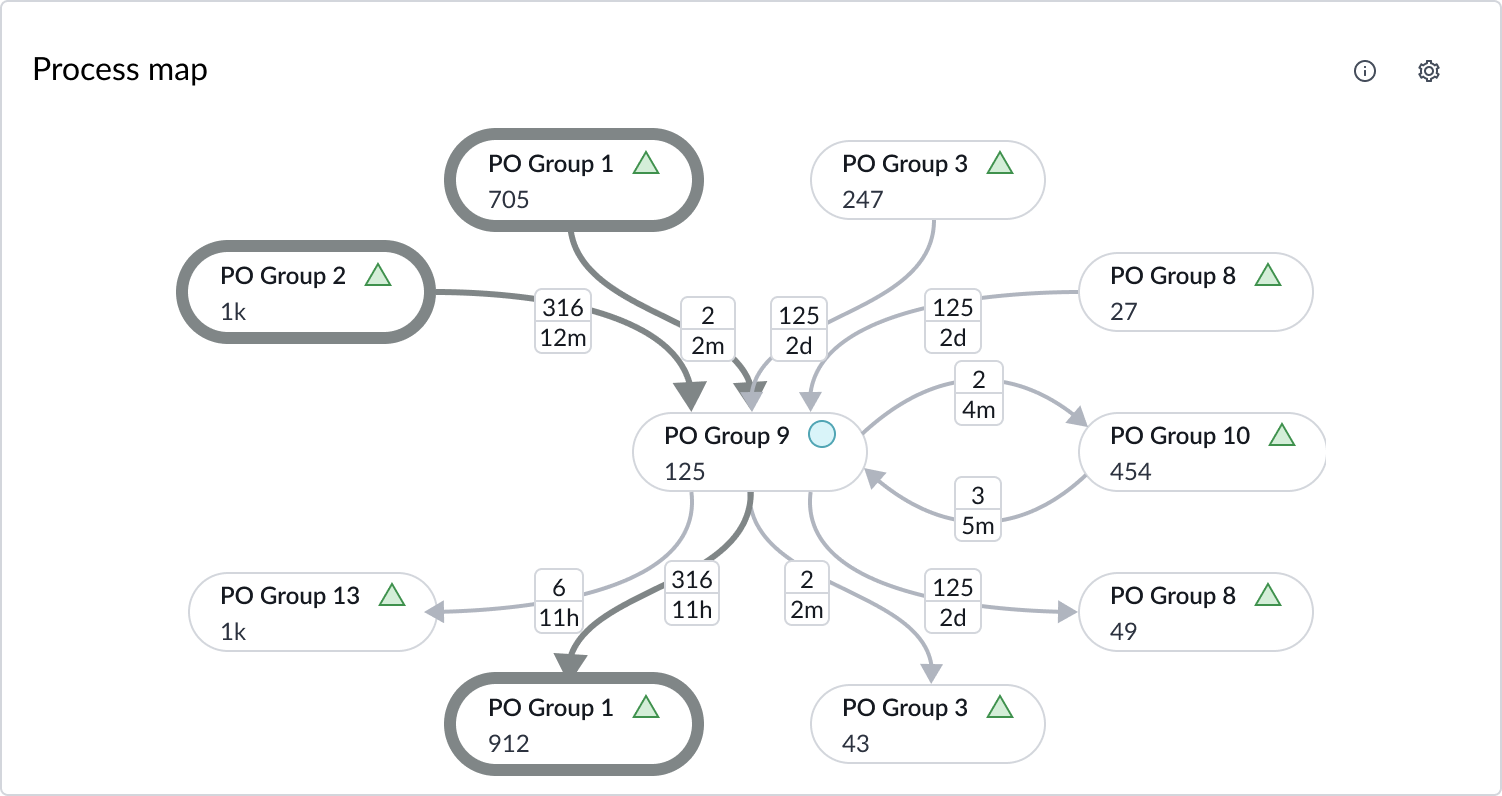
The star graph type of diagram displays the inputs and outputs for a selected node. The selected activity node displays in the middle of the star graph with the input and output connections and nodes around it.
Activity nodes and connections use border thickness and color to visually differentiate the number of records for the selected node in the process optimization map.
Configurations
Learn how to customize process optimization map by configuring the available properties.
Header and border
The component header displays in the top left and contains the title. You can show or hide the header and add a header separator line between the header and the map. By default, the header is configured to show, but the content is empty if you don’t include a chart title. You can also show or hide a bordering box around the chart. You can add an optional description that appears when the user hovers over the information icon in the top-right.
Data properties
Use the data properties to select and organize the data you want your users to see from the source. Select the chevron icon to expand a section and display the properties in each category.
Process optimization project
Search for and select the process optimization project to link to this component. Data from the selected project populates the process optimization map when placed into a workspace.
Type of diagram
There are two types of diagrams, the Process graph and the Star graph. Process graph is the default.
Note: With the Process graph default, users can access the Star graph for each activity node. If you set Star graph as the default, the user only sees the Star graph and can’t access the Process graph.
Process graph orientation
By default, the process map graph flows vertically from top to bottom, but you can change it to flow horizontally from left to right or right to left - depending on the language.
Filters
You can apply transition filters on the Process map to visualize how the process is being executed when the selected transition(s) always occur.
Connections
For the process graph view, 20% of the most common connections display. If a minimum of 5 nodes don’t display, then process optimization map adjusts to display another 5% to ensure at least 5 nodes show.
Activities
For the process graph view, you can select the percentage of most frequent activities to be visualized by default.
Case follow simulation
On the process graph view, simulation displays as animation on the connections. The speed of the animation is based on the connection performance (time); the lower the time, the slower the dashes move; the faster the time, the faster the dashes move.
By default, the simulation is turned off, but the user can turn it on in the process map settings. You can turn the simulation on, but the user is able to disable it.
Activity node and connection actions
When a user double-clicks an activity node or a connection, a popup opens. By default, the popup contains action buttons, but you can hide them if you prefer. For nodes, the available action is Show records. For connections, the available actions are Show records, Filter on transition, and Work notes analysis.
Design recommendations
The process optimization map component works best when there is ample space on the dashboard to display the component both vertically and horizontally. Avoid using the component in a space smaller than one-third of the screen width.
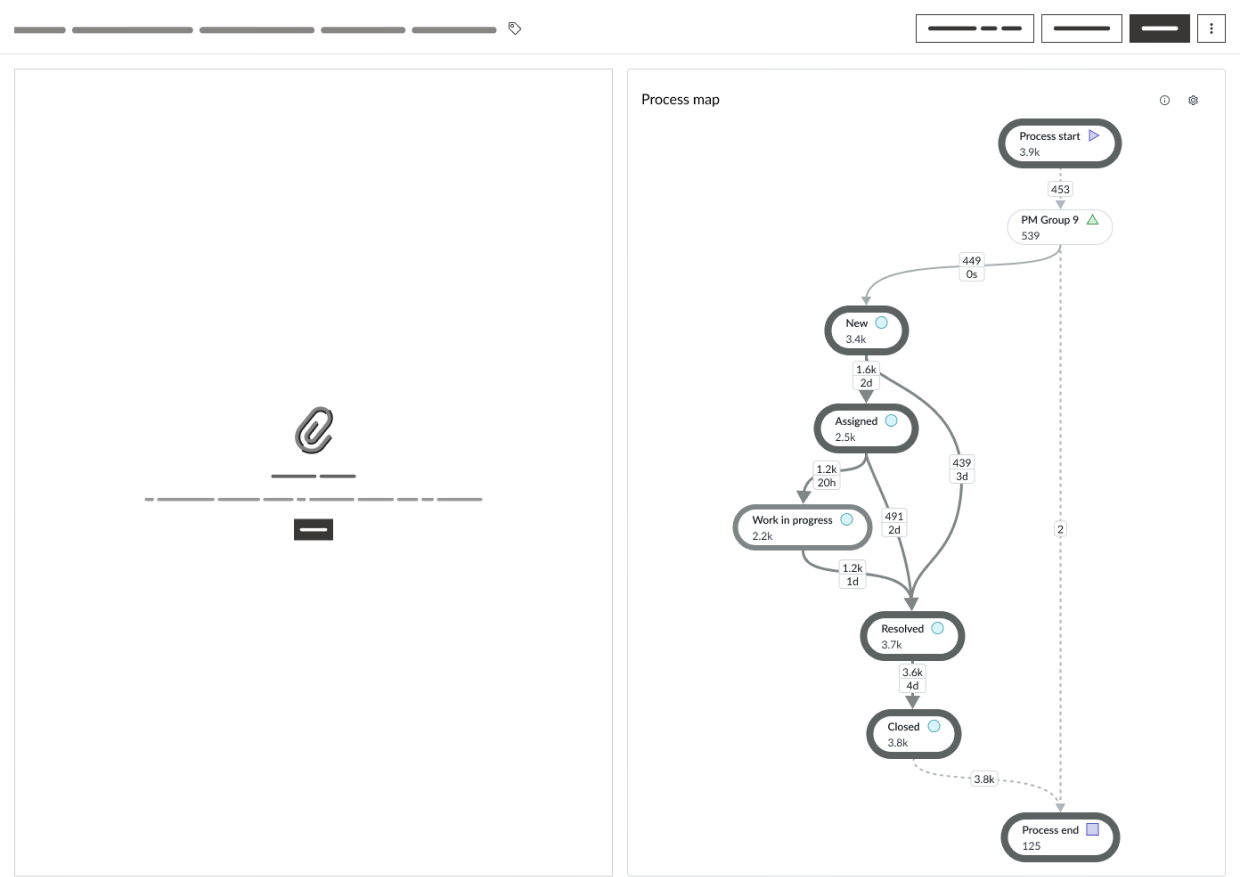
Process map component works best when space is ample
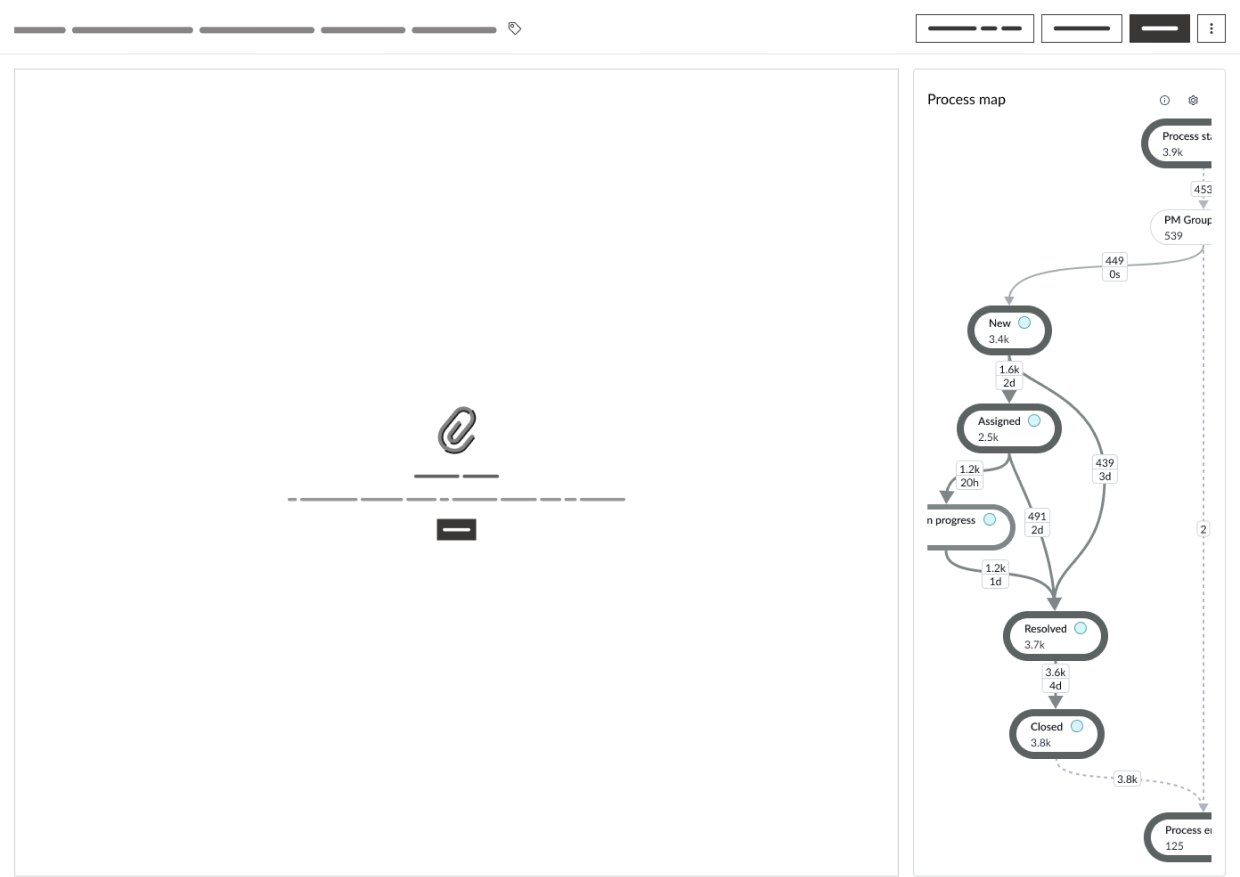
Avoid using the process map component when space is limited
Behavior
Learn how process optimization map behaves when the display changes or a user interacts with the component.
States
Process optimization map has the following states for nodes and connections.
| State | Example |
|---|---|
| Default | |
| Hover | |
| Hover (with truncation) | |
| Focus |
| State | Example |
|---|---|
| Default | 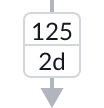 |
| Hover | 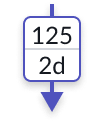 |
| Focus | 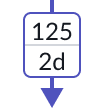 |
Responsive behaviors
Learn how process optimization map responds to changes in a container or display.
Truncation
When text in activity node exceeds the width of the container or content area, the text truncates with an ellipsis, and a tooltip shows the full content on hover.

Interactions
Learn how process optimization map responds when a user interacts with it.
Access the Star graph
In a process graph, when a user selects a node, the star graph for that node appears showing only the connectors and activity nodes that are directly connected to it.
Activity node information
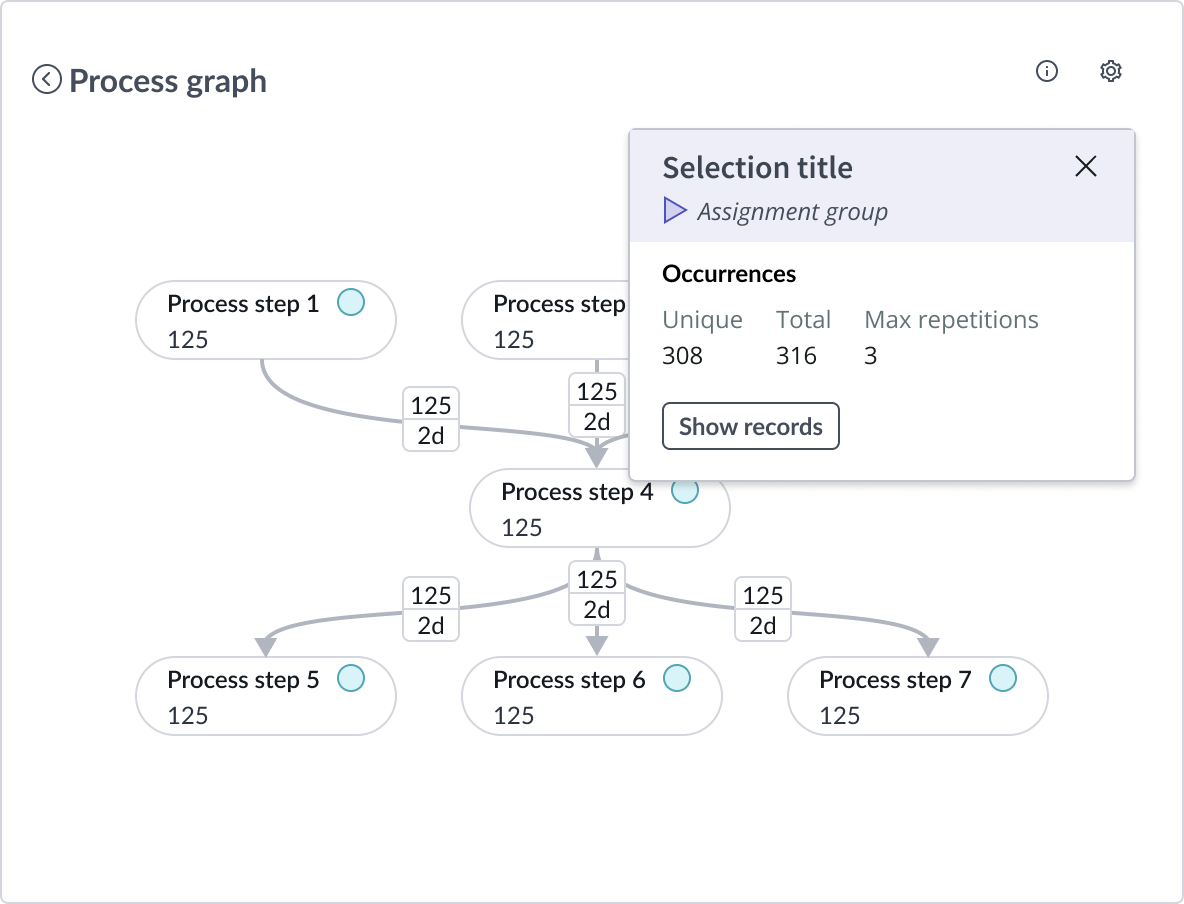
In a star graph, when a user selects a node, a popup opens.
Occurrences provides the metrics for what occurred on the selected activity node in the process.
- Unique is the number of unique records or incidents that were a part of this step. In the example below, 308 records were a part of the selected step in the process.
- Total is the total number of records or incidents that were a part of this step - including where this step occurred multiple times for a step. In the example below, 316 records - including repeats - were a part of the selected step.
- Max repetitions is the maximum number of times a single incident or record was repeated for this step. In the example below, at least 1 record went through this step 3 times.
The user can also access more information through the “Show records” button that displays all the records relevant to the node.
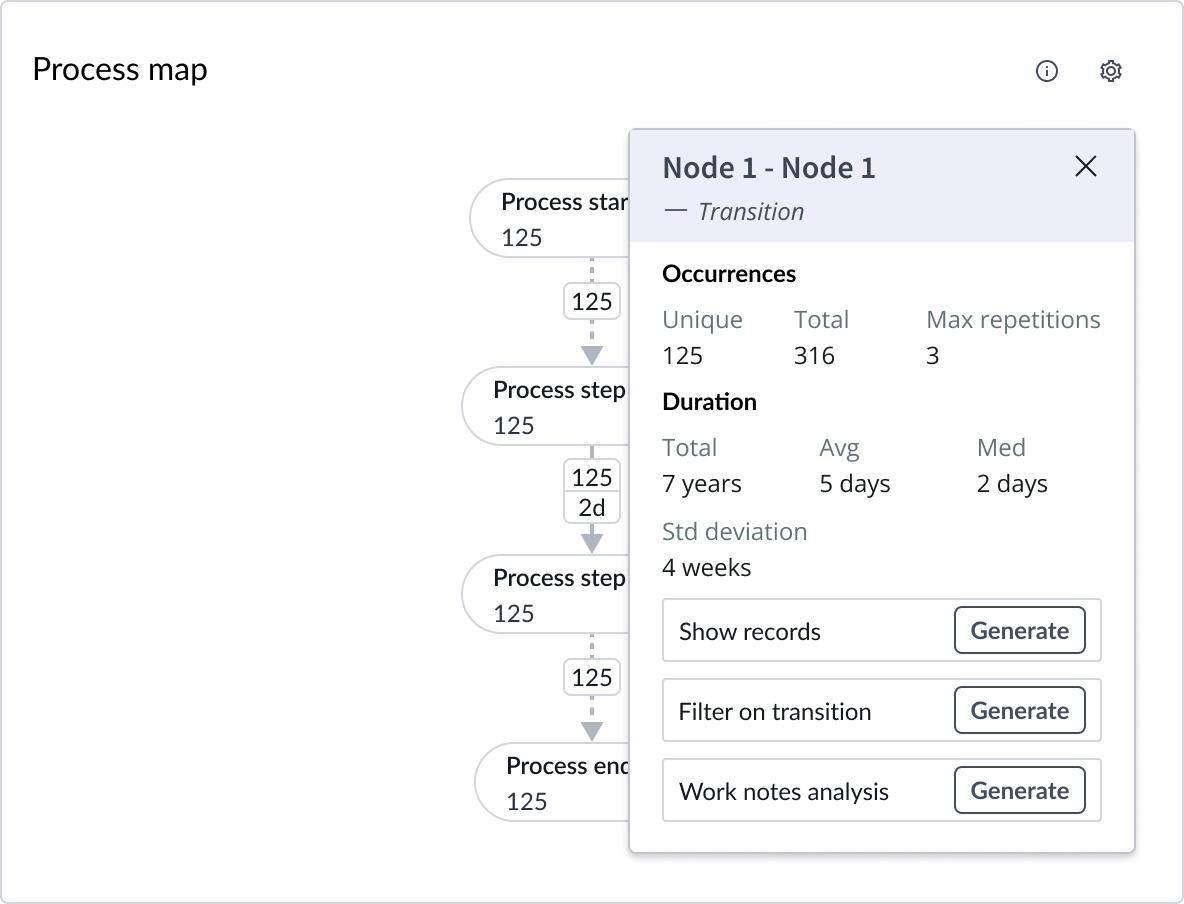
Connection information
When a user selects a connection between two activity nodes, a popup opens.
Occurrences provides the metrics for what occurred on the selected transition between 2 activity nodes in the process.
- Unique is the number of unique records or incidents that moved through the selected connection. In the example below, 125 unique records went from the first node to the next one on the selected connection.
- Total is the total number of records or incidents that moved through the selected connection - including the same record repeating the same path. In the example below, 316 total records went from the first node to the second one on the selected connection.
- Max repetitions is the maximum number of times a single record or incident moved through this connection. In the example below, at least 1 record went from the first node to the second node 3 times.
Duration provides information about how long it takes records or incidents to move through the selected connection.
- Total is the total time it takes all records or incidents to move through the selected connection.
- Avg is the average duration it takes records or incidents to move through the selected connection.
- Med is the median, the middle number of a sorted ascending or descending list, duration it takes records or incidents to move through the connection.
- Std deviation is the duration variation to the mean of all records.
This popup also lets the user generate related records, filter on the transition, and generate a work notes analysis.
Graph settings
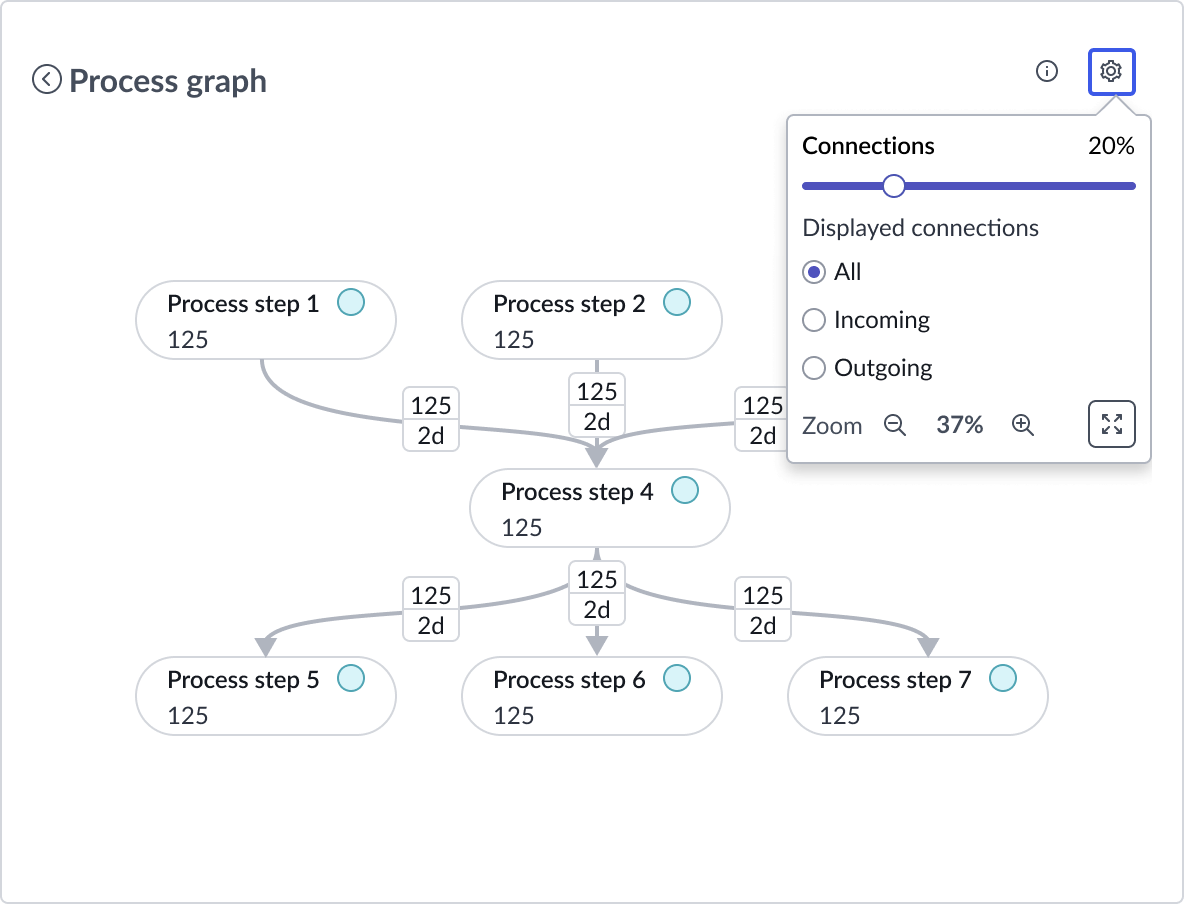
In a star graph, when a user selects the settings (cog) icon, the Connections popup opens.
In this popup, the user can:
- Adjust the percentage of connections displayed, which affects what activity nodes are available.
- Select to display All, Incoming, or Outgoing connections and their activity nodes. All (default) displays all connections and the activity nodes that take place before and after the central activity node. Incoming displays only the activity nodes that occur before the central activity node and their connections to the central node. Outgoing displays only the activity nodes that occur after the central activity node and their connections from the central node.
- Zoom in and out of the graph, or zoom to fit the full screen.
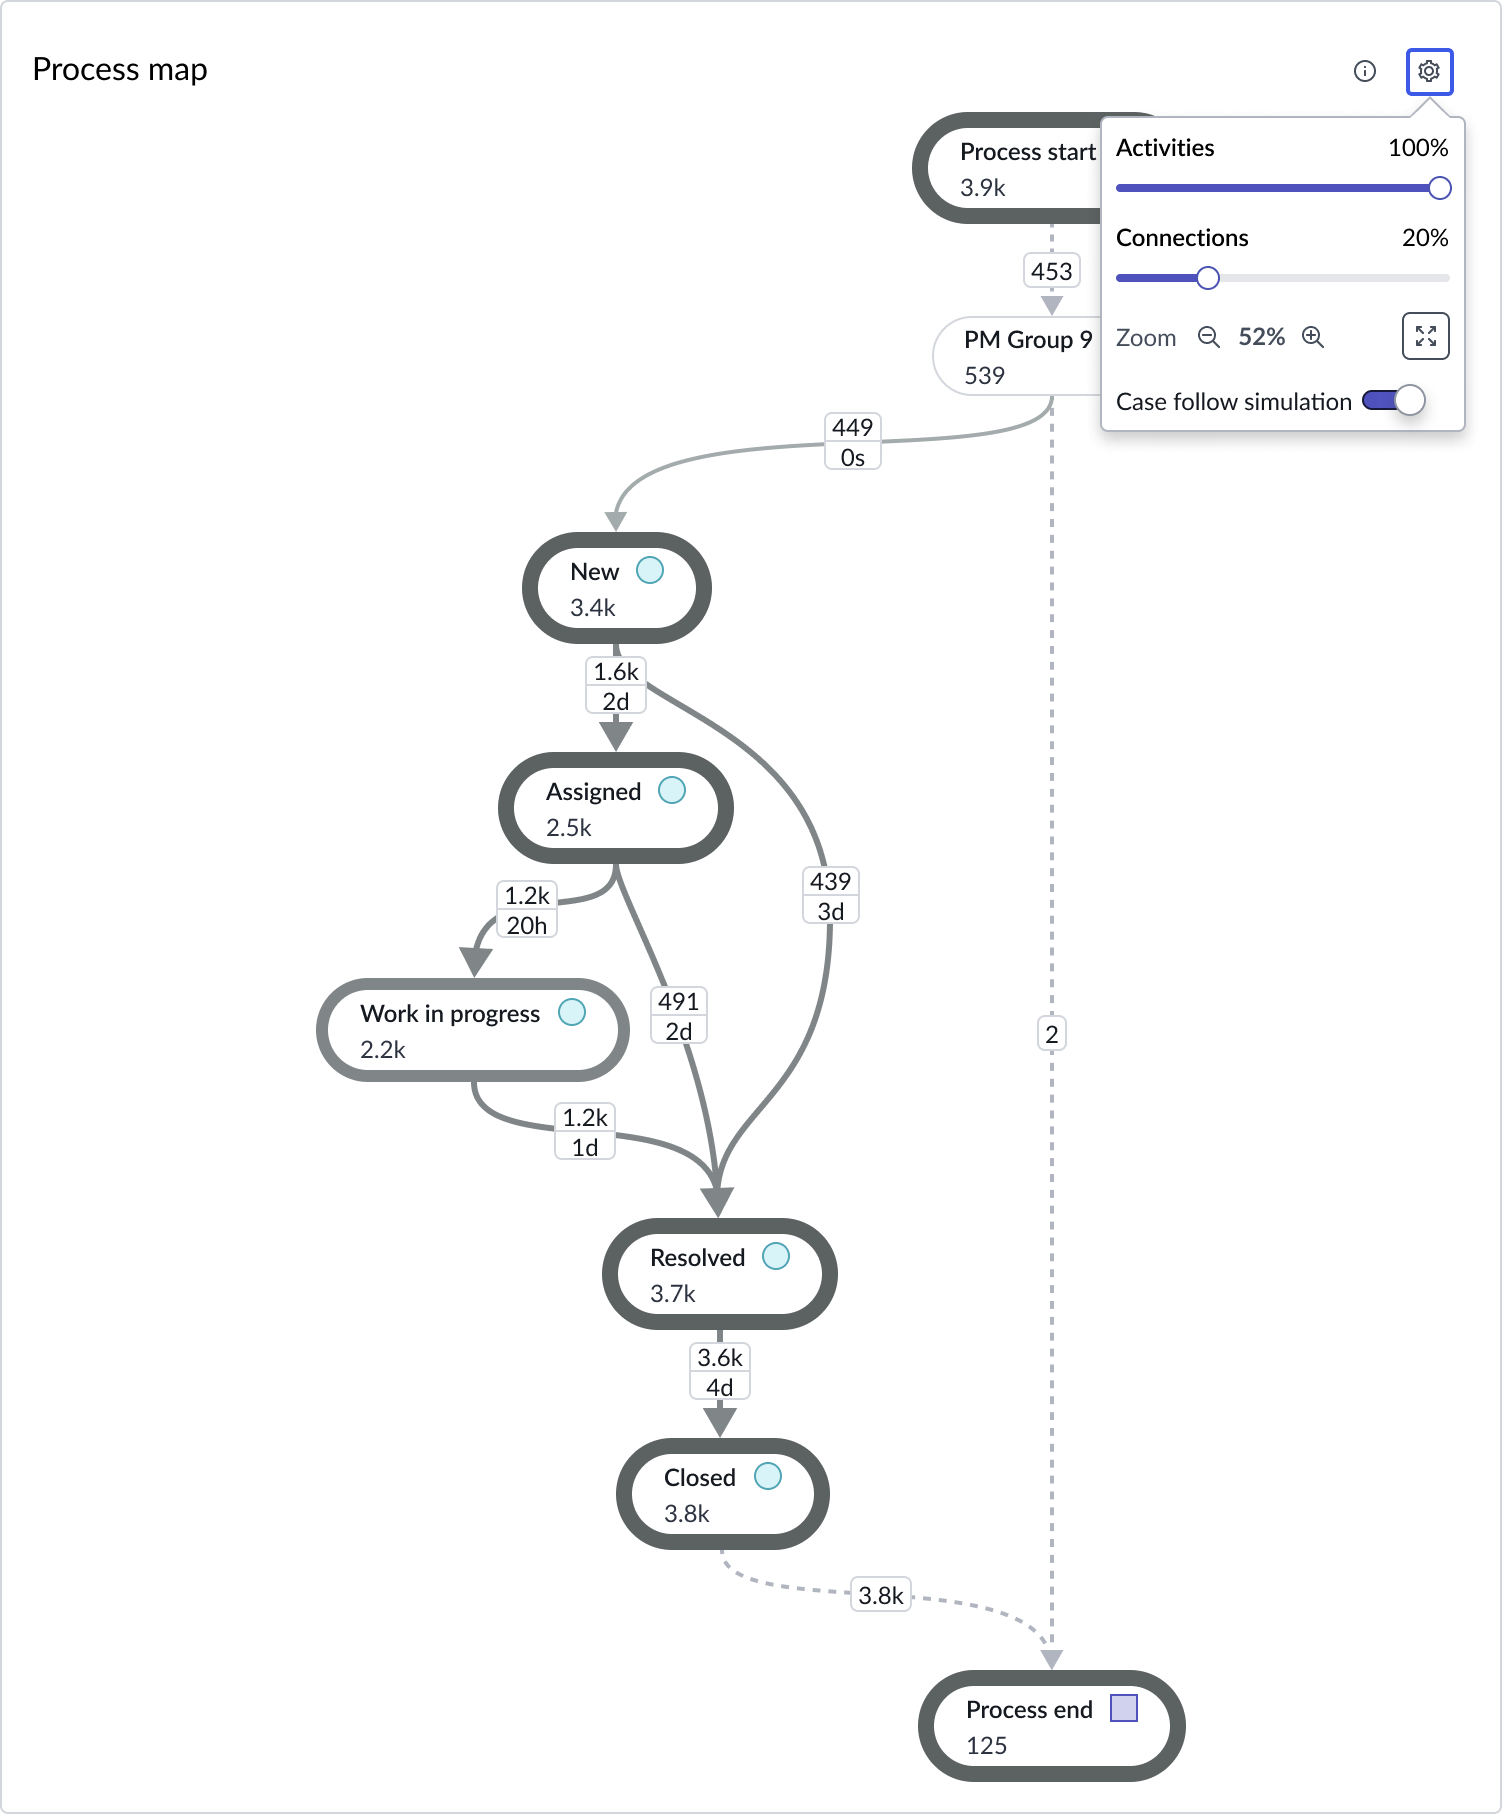
In a process graph, when a user selects the settings (cog) icon, a process graph related popup opens. In this popup, the user can increase or decrease the percentage of activity nodes and the percentage of connections shown on the process map. Zoom in or out of the graph, and zoom to fit the full screen can also be accessed.
The user can also toggle the “Case follow simulation” on and off. Toggled on, connections become dashed and are animated.
Usability
Process optimization map complies with all internationalization and accessibility requirements.
Internationalization
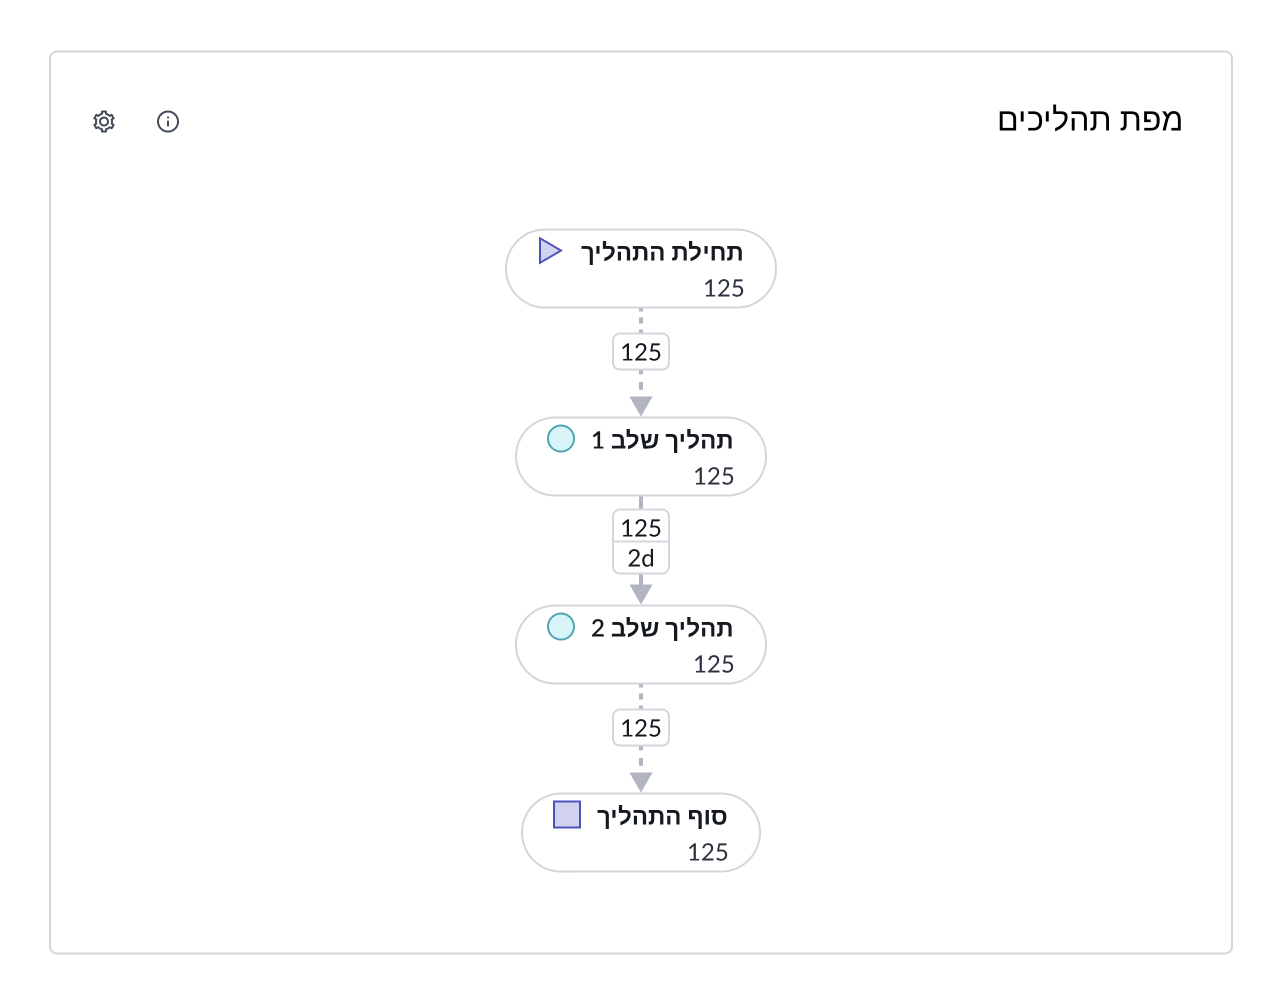
When this component is used in a platform configured for a right-to-left (RTL) language, the header and order of information in the nodes changes to RTL.
Accessibility
Learn how to access the actionable elements of
Process optimization map tab order
This is the tab order for process optimization map:
Keyboard interactions
Users can interact with process Map using the keyboard.
You can access the actionable elements of process graph with these keyboard keys:
- Tab: Moves focus to the next element in process graph
- Shift + Tab: Moves focus to the previous element
- Enter/return: Triggers element action
When the focus is on the process graph or star graph:
- Up or down arrow: navigates up or down in the process or star graph
- Left or right arrow: navigates left or right in the process or star graph
Focus on the transition :
- Spacebar or Enter/return: opens the transition popover
Focus on the node in process diagram view :
- Spacebar or Enter/return: changes the visualization from the process map view to the star graph view
Focus on the node in star graph view :
- Spacebar or Enter/return: opens the node popover
Screen readers
When you apply ARIA labels to a component, screen readers announce the controls and content of process map in the prescribed tab order.

